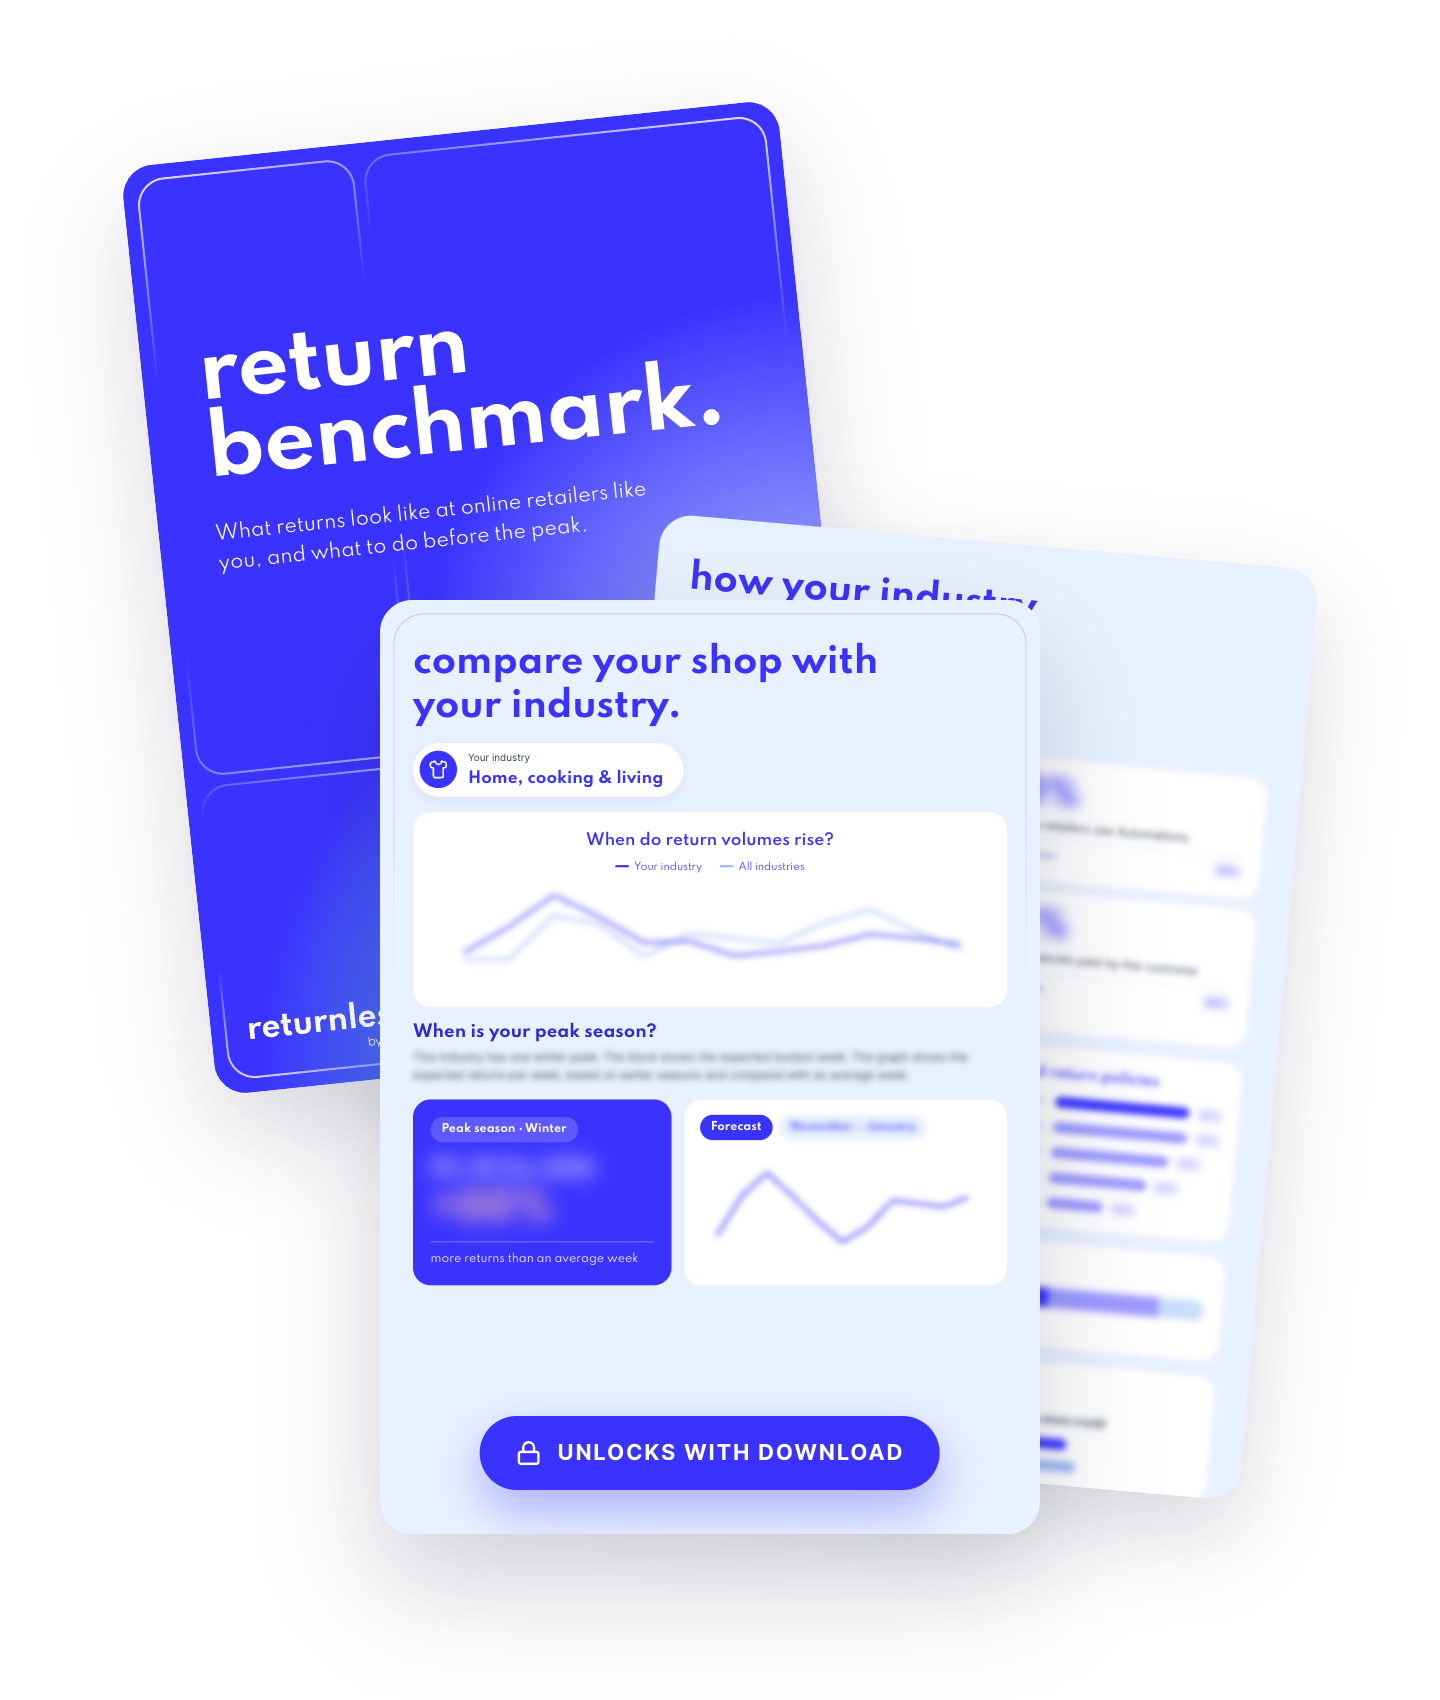
compare your shop with your industry.
Everything you need to know about returns in peak season, compared by industry. How do you perform to other online retailers in your industry?
Your industry's busiest return week, and how to plan for it
What customers in your industry return, and why
Whether your return policy is normal for your industry
Get your Return Benchmark.
The Return Benchmark 2026 in numbers
When does peak season hit returns?
The curve above is the average. Your industry's busiest weeks can fall weeks, or even months, apart from it.
Unlock your industrySource: Returnless data. The line is the forecast for created returns during peak season 2026–2027 over all indu, based on the 2024–2025 and 2025–2026 seasons. The band shows the range between those two seasons, week by week.
your industry’s returns, on one page.
Get the full report plus a personal page for your industry: your busiest return weeks, top 5 return reasons, most common return period, paid or free share and store credit, compared with all industries.
more from the benchmark.

BLOG · 7 MIN READ
24 November 2025 - Six practical tips to keep return costs down and sales up during the busiest time of the year. From return data and sale items to return periods and store credit.
BLOG · 6 MIN READ
16 December 2025 - Automation, sustainability, return data and store credit changed how online retailers handle returns. Find out which trends turn returns from a cost into an advantage.

BLOG · 8 MIN READ
6 January 2026 - Christmas gifts come back after the holidays, and for half of all online retailers capacity is the biggest challenge. Six best practices to get through January without delays.
FAQ.
What is the Return Benchmark 2026
The Return Benchmark 2026 is the yearly report on return data and trends for online retailers by Returnless by JTL. It is released before peak season, so you can compare your own returns with the market and prepare for the busiest weeks of the year.
Who is the Return Benchmark for?
For online retailers, e-commerce managers and fulfilment teams who want to know how their returns compare with other online retailers. Whether you are planning staff for peak season or reviewing your return policy, the benchmark gives you a reference point.
What insights are in the report?
More than 250 data insights on returns in peak season and beyond. Among other things: when return volumes rise, why customers return, which return periods and policies are most common, how online retailers charge for returns, and how much is resolved with store credit.
What is the industry page?
Next to the full report, you get a personal page for your industry. It compares your industry with all industries: your busiest return weeks, top 5 return reasons, most common return period, paid or free share and store credit. There are pages for 11 industries.
Where does the data come from?
From more than 1,500 online retailers that process their returns through Returnless. The data covers October 2025 to September 2026 and is compared with the same online retailers a year earlier.
Is the Return Benchmark free?
Yes. Fill in the form at the top of this page and choose your industry. The full report and your industry page land in your inbox.
compare yourself to other online retailers in your industry.
Get the full Return Benchmark 2026, including data and trends around peak season, plus your personal industry page.