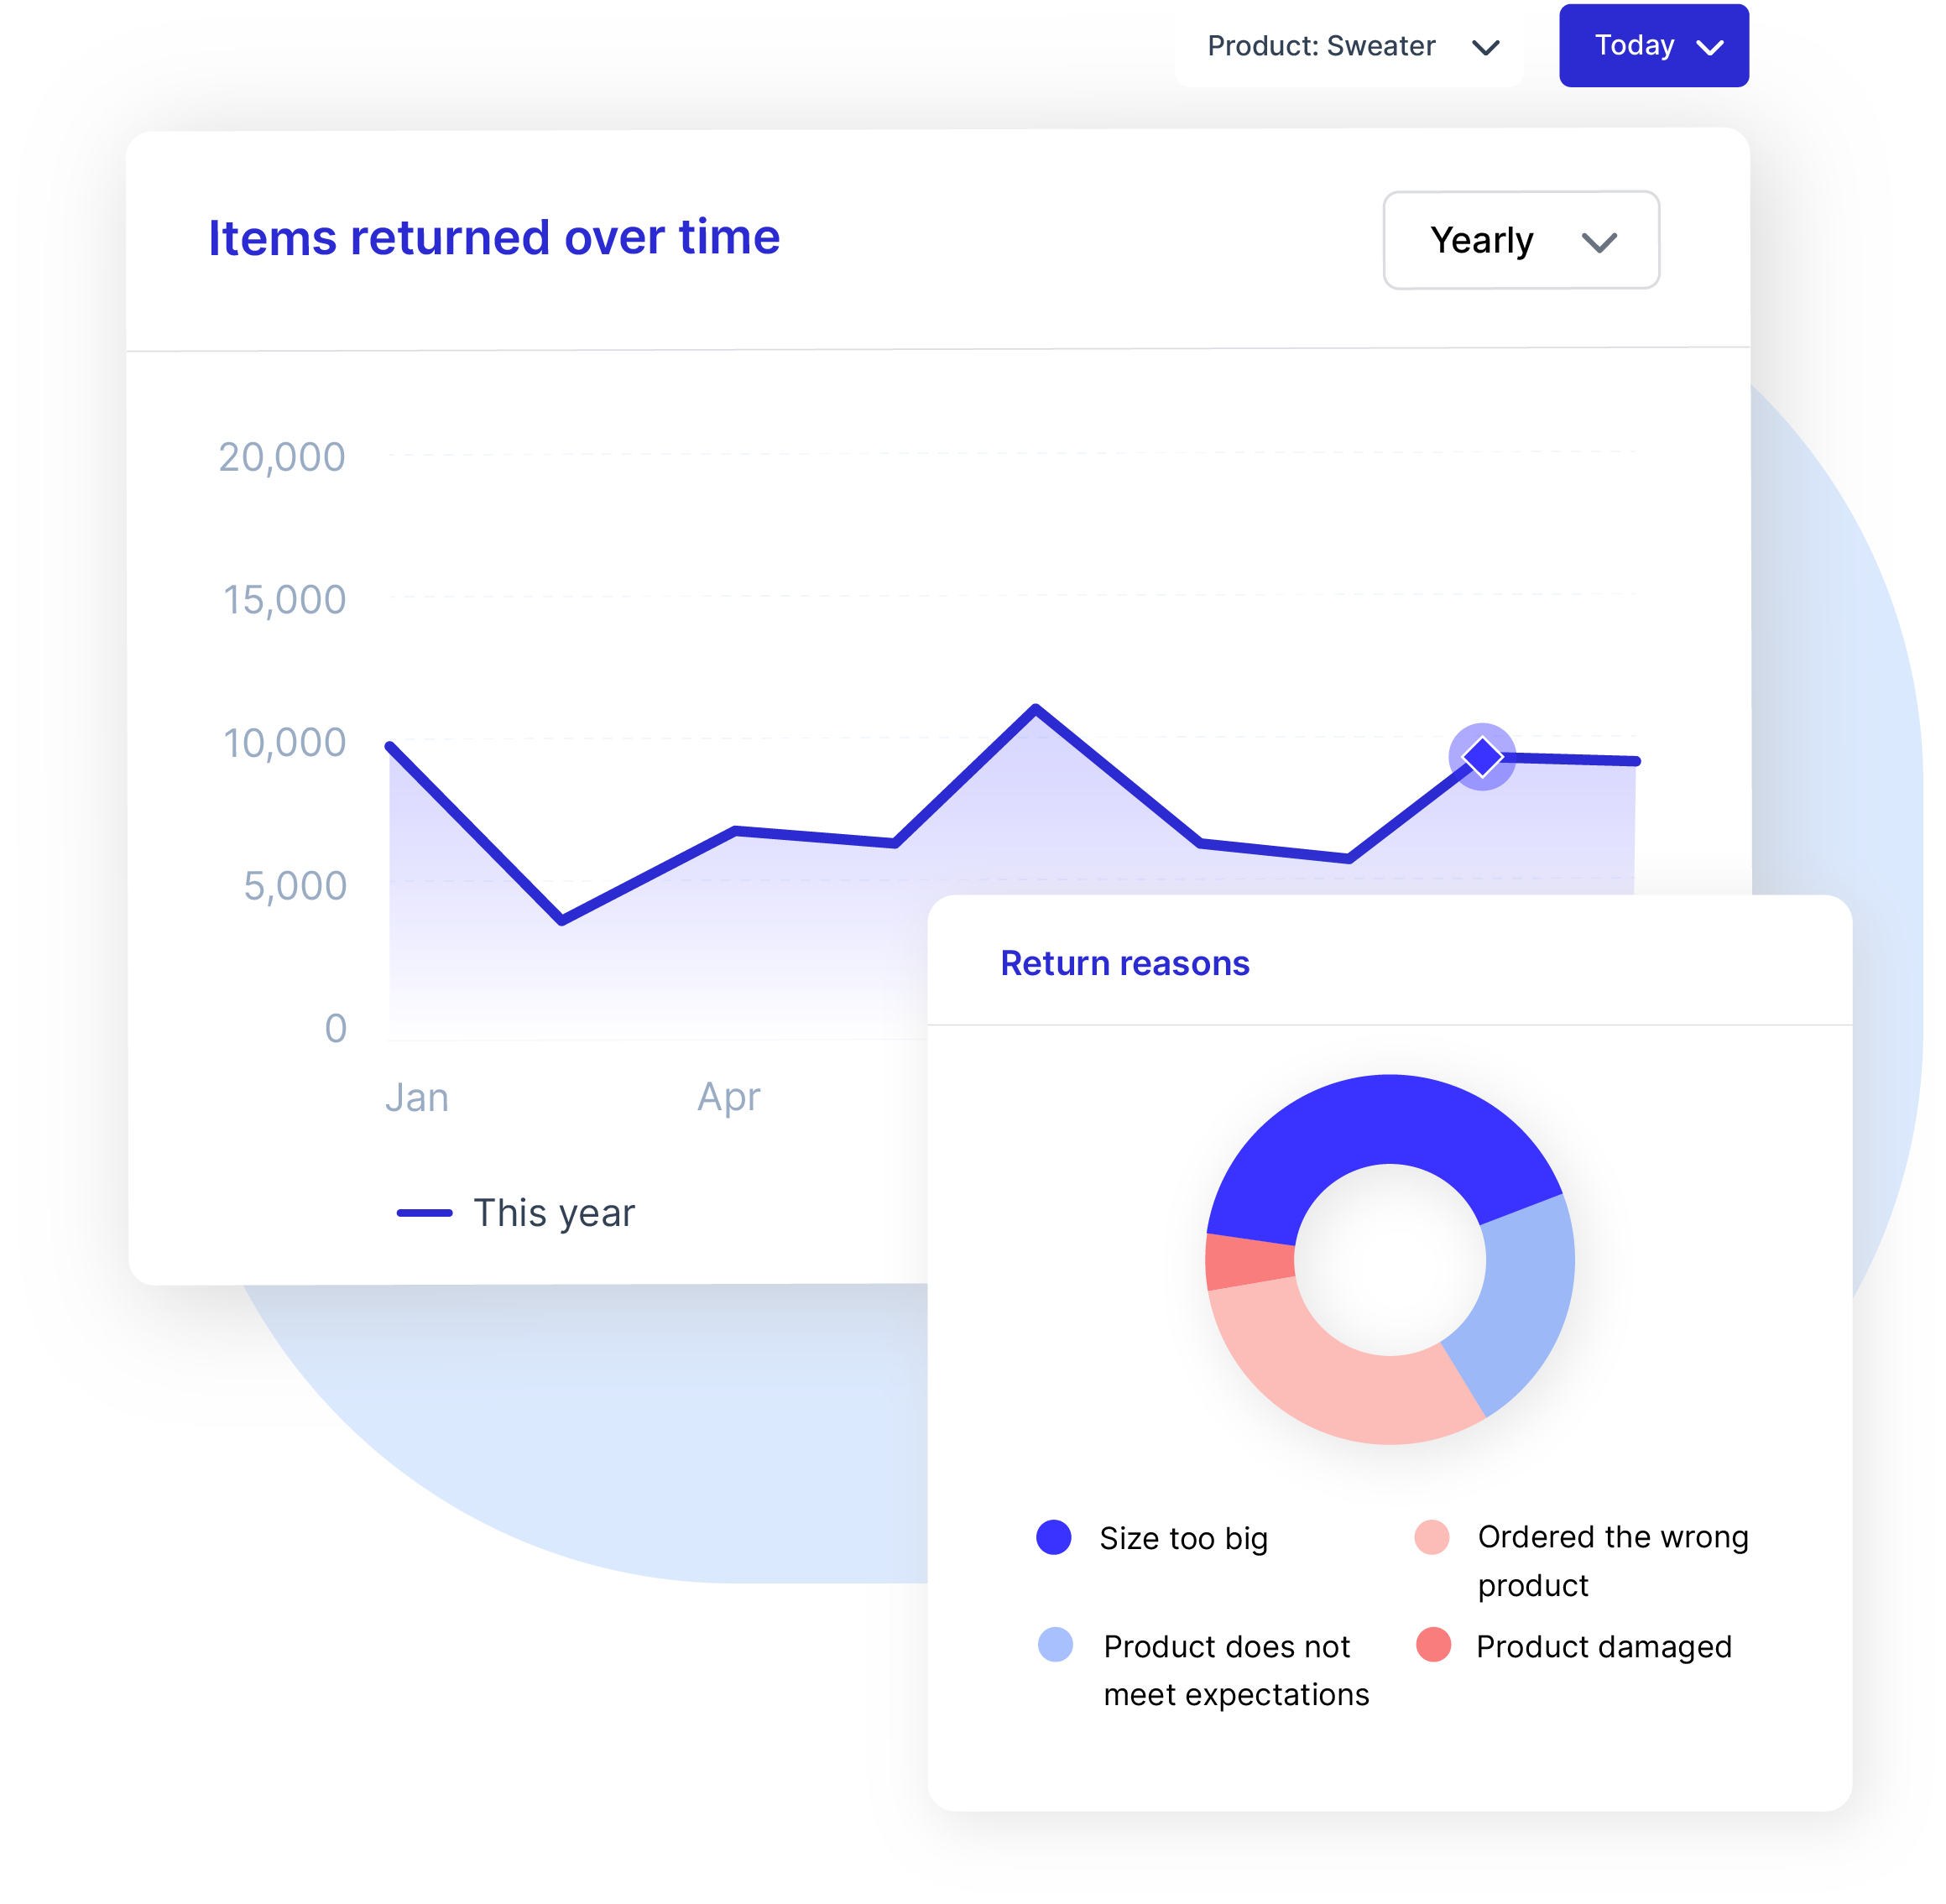
turn guesswork into data.

Stop reacting to returns. Return Analytics show you exactly where revenue leaks and why returns happen — and exactly what to do about it.

Monitor returned items, restocked inventory, and total returned value
Track retained revenue from every coupon conversion
Understand where to focus, what to fix, and what to stop selling
Clear dashboards for products, retention, shipping and more

Arjan
“To make smarter product decisions, you first need the right data. Return Analytics give you exactly that."
Product Analytics - vertical overview@3x

insights that fuel healthy growth. 

  • -18%
    Fewer returns
    Average reduction of returned items after using return analytics insights
  • €15k+
    Revenue retained
    On average, monthly per merchant, through coupons instead of cash refunds
  • 3x
    Faster detection
    By instantly spotting high-return products due to filters, ranks and tracking improvements over time

find the products costing you most.

Often, only a handful of products drive the largest share of your returns. High-return products rarely fix themselves. What they need is clear data: amount of returns, return reason, and a signal to act. Returnless gives you all three - ranked, filterable, and always up to date.

Drill into each product to see which reasons are driving returns. Take targeted action - rewrite the listing, improve the size guide - then watch the numbers move as you make changes.

Rank products by return volume and value
Drill into reasons for each product instantly
Track improvement over time as you make fixes
Export data to share across your team


Product Analytics - timeline and return reason@3x
Retention Analytics - Overview - Movement@3x

retain revenue through smarter returns.

Not every return has to be a refund. Track coupon conversions and see the exact amount of revenue you retained. Returnless makes coupon offers a natural part of your return process, and our analytics tell you exactly how well it's working.

Track coupon conversion rates by product, category, or time period. See month-over-month trends. Know which products generate the most retained revenue. Use that insight to optimise your offer.

See exactly how much revenue is retained
Compare refunds vs. coupons value over time
Analyse retained value by product
One-click reports to share with leadership

powerful dashboards.

Built for e-commerce teams

Use specific dashboards that give you visibility at every level of your return proces. Each dashboard is designed to answer specific business questions, not just to display data. 

Product Analytics

Product Analytics

Identify what drives returns 

Analyse data on a product level. Allowing you to identify patterns, improve quality, and reduce future returns.

Which products are returned most frequently?
Which product are driving return costs?
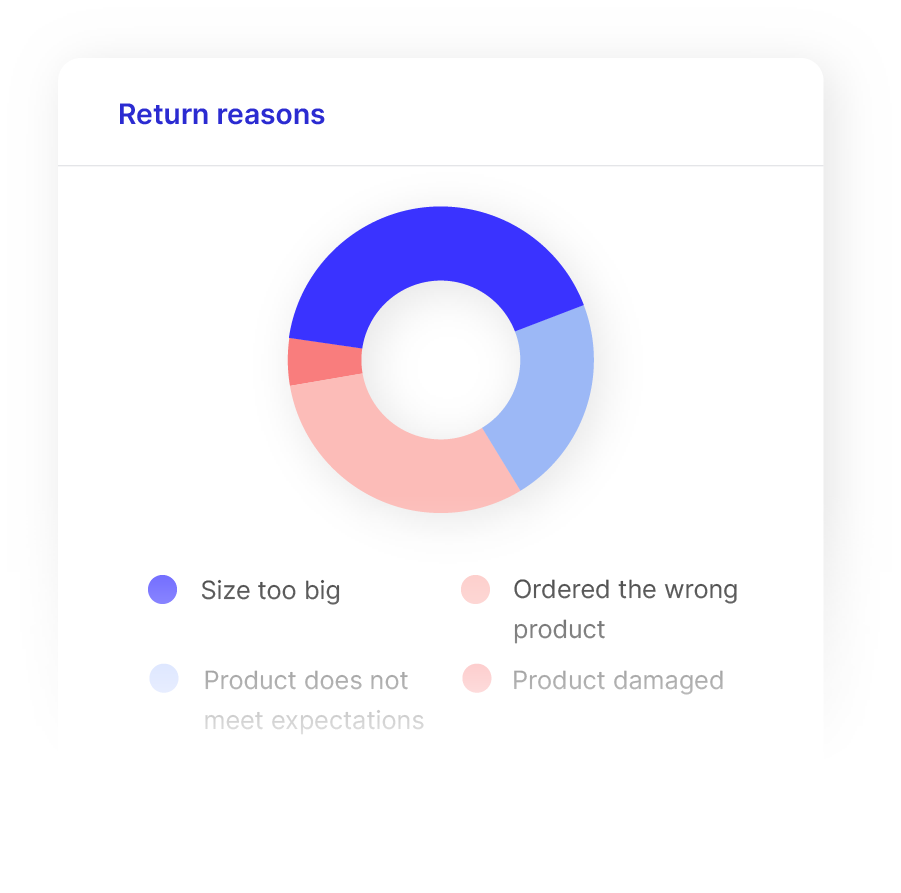
What are the most common return reasons per product?
Which products show seasonal return peaks?
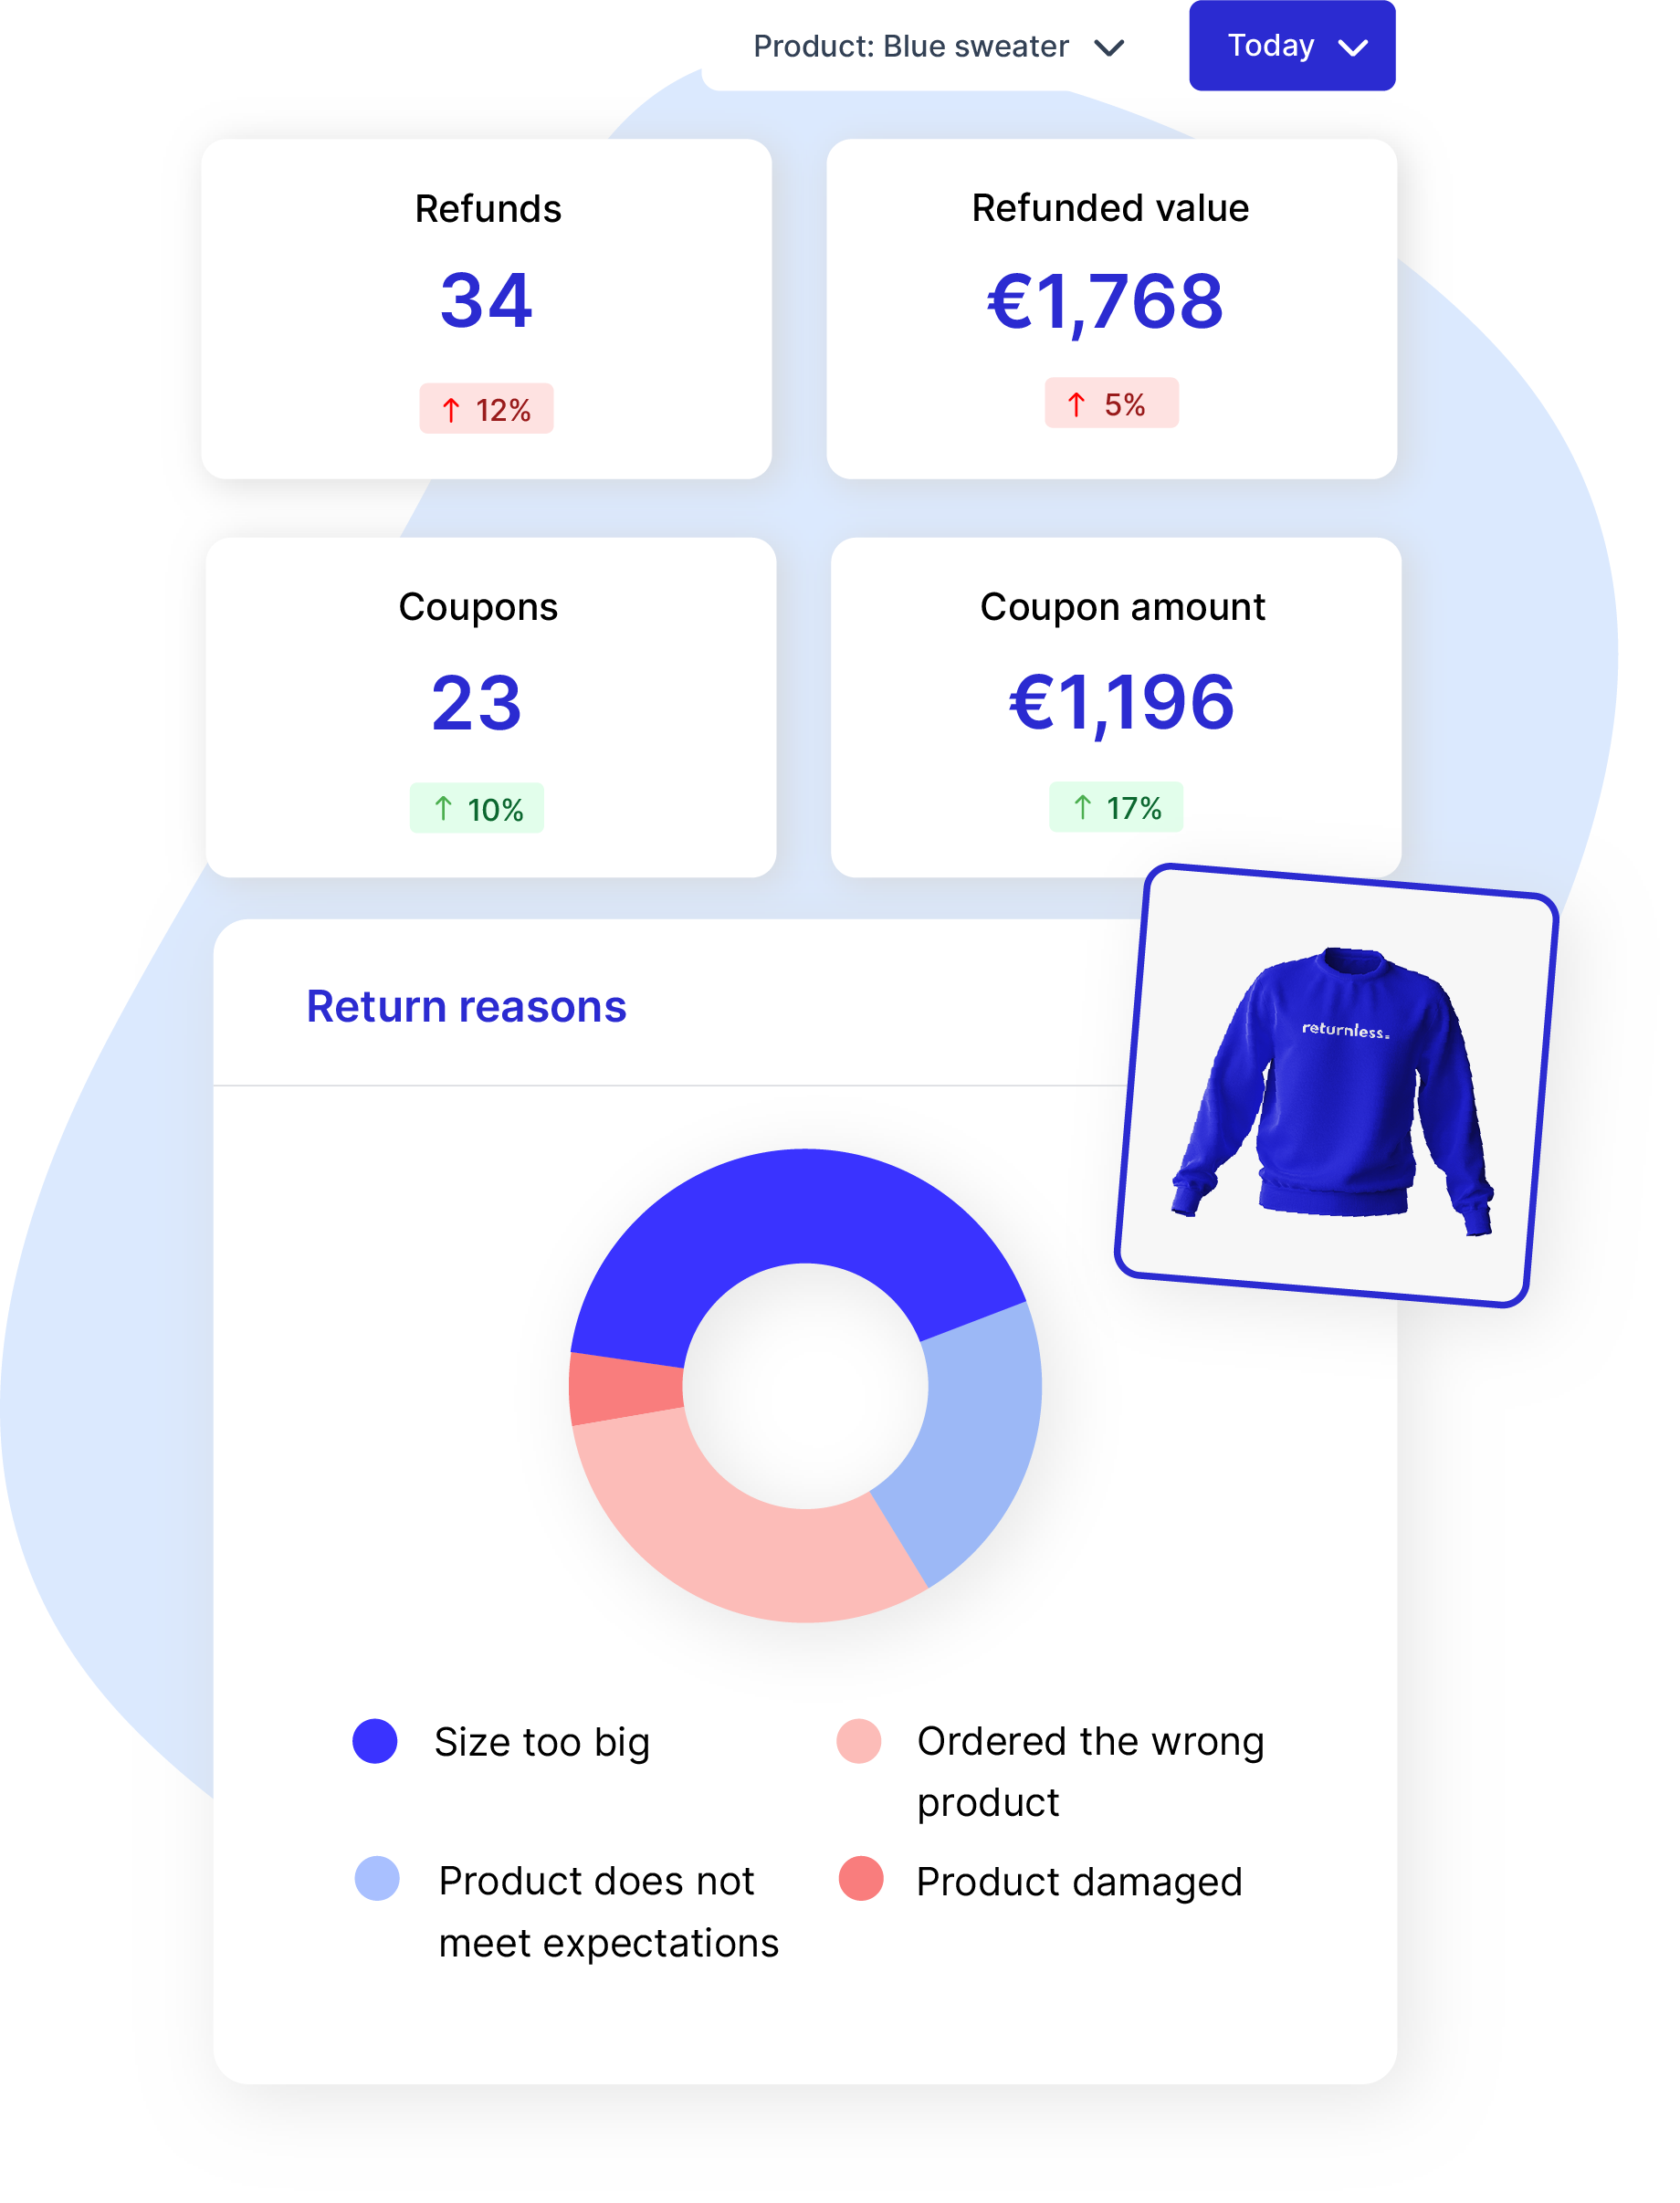
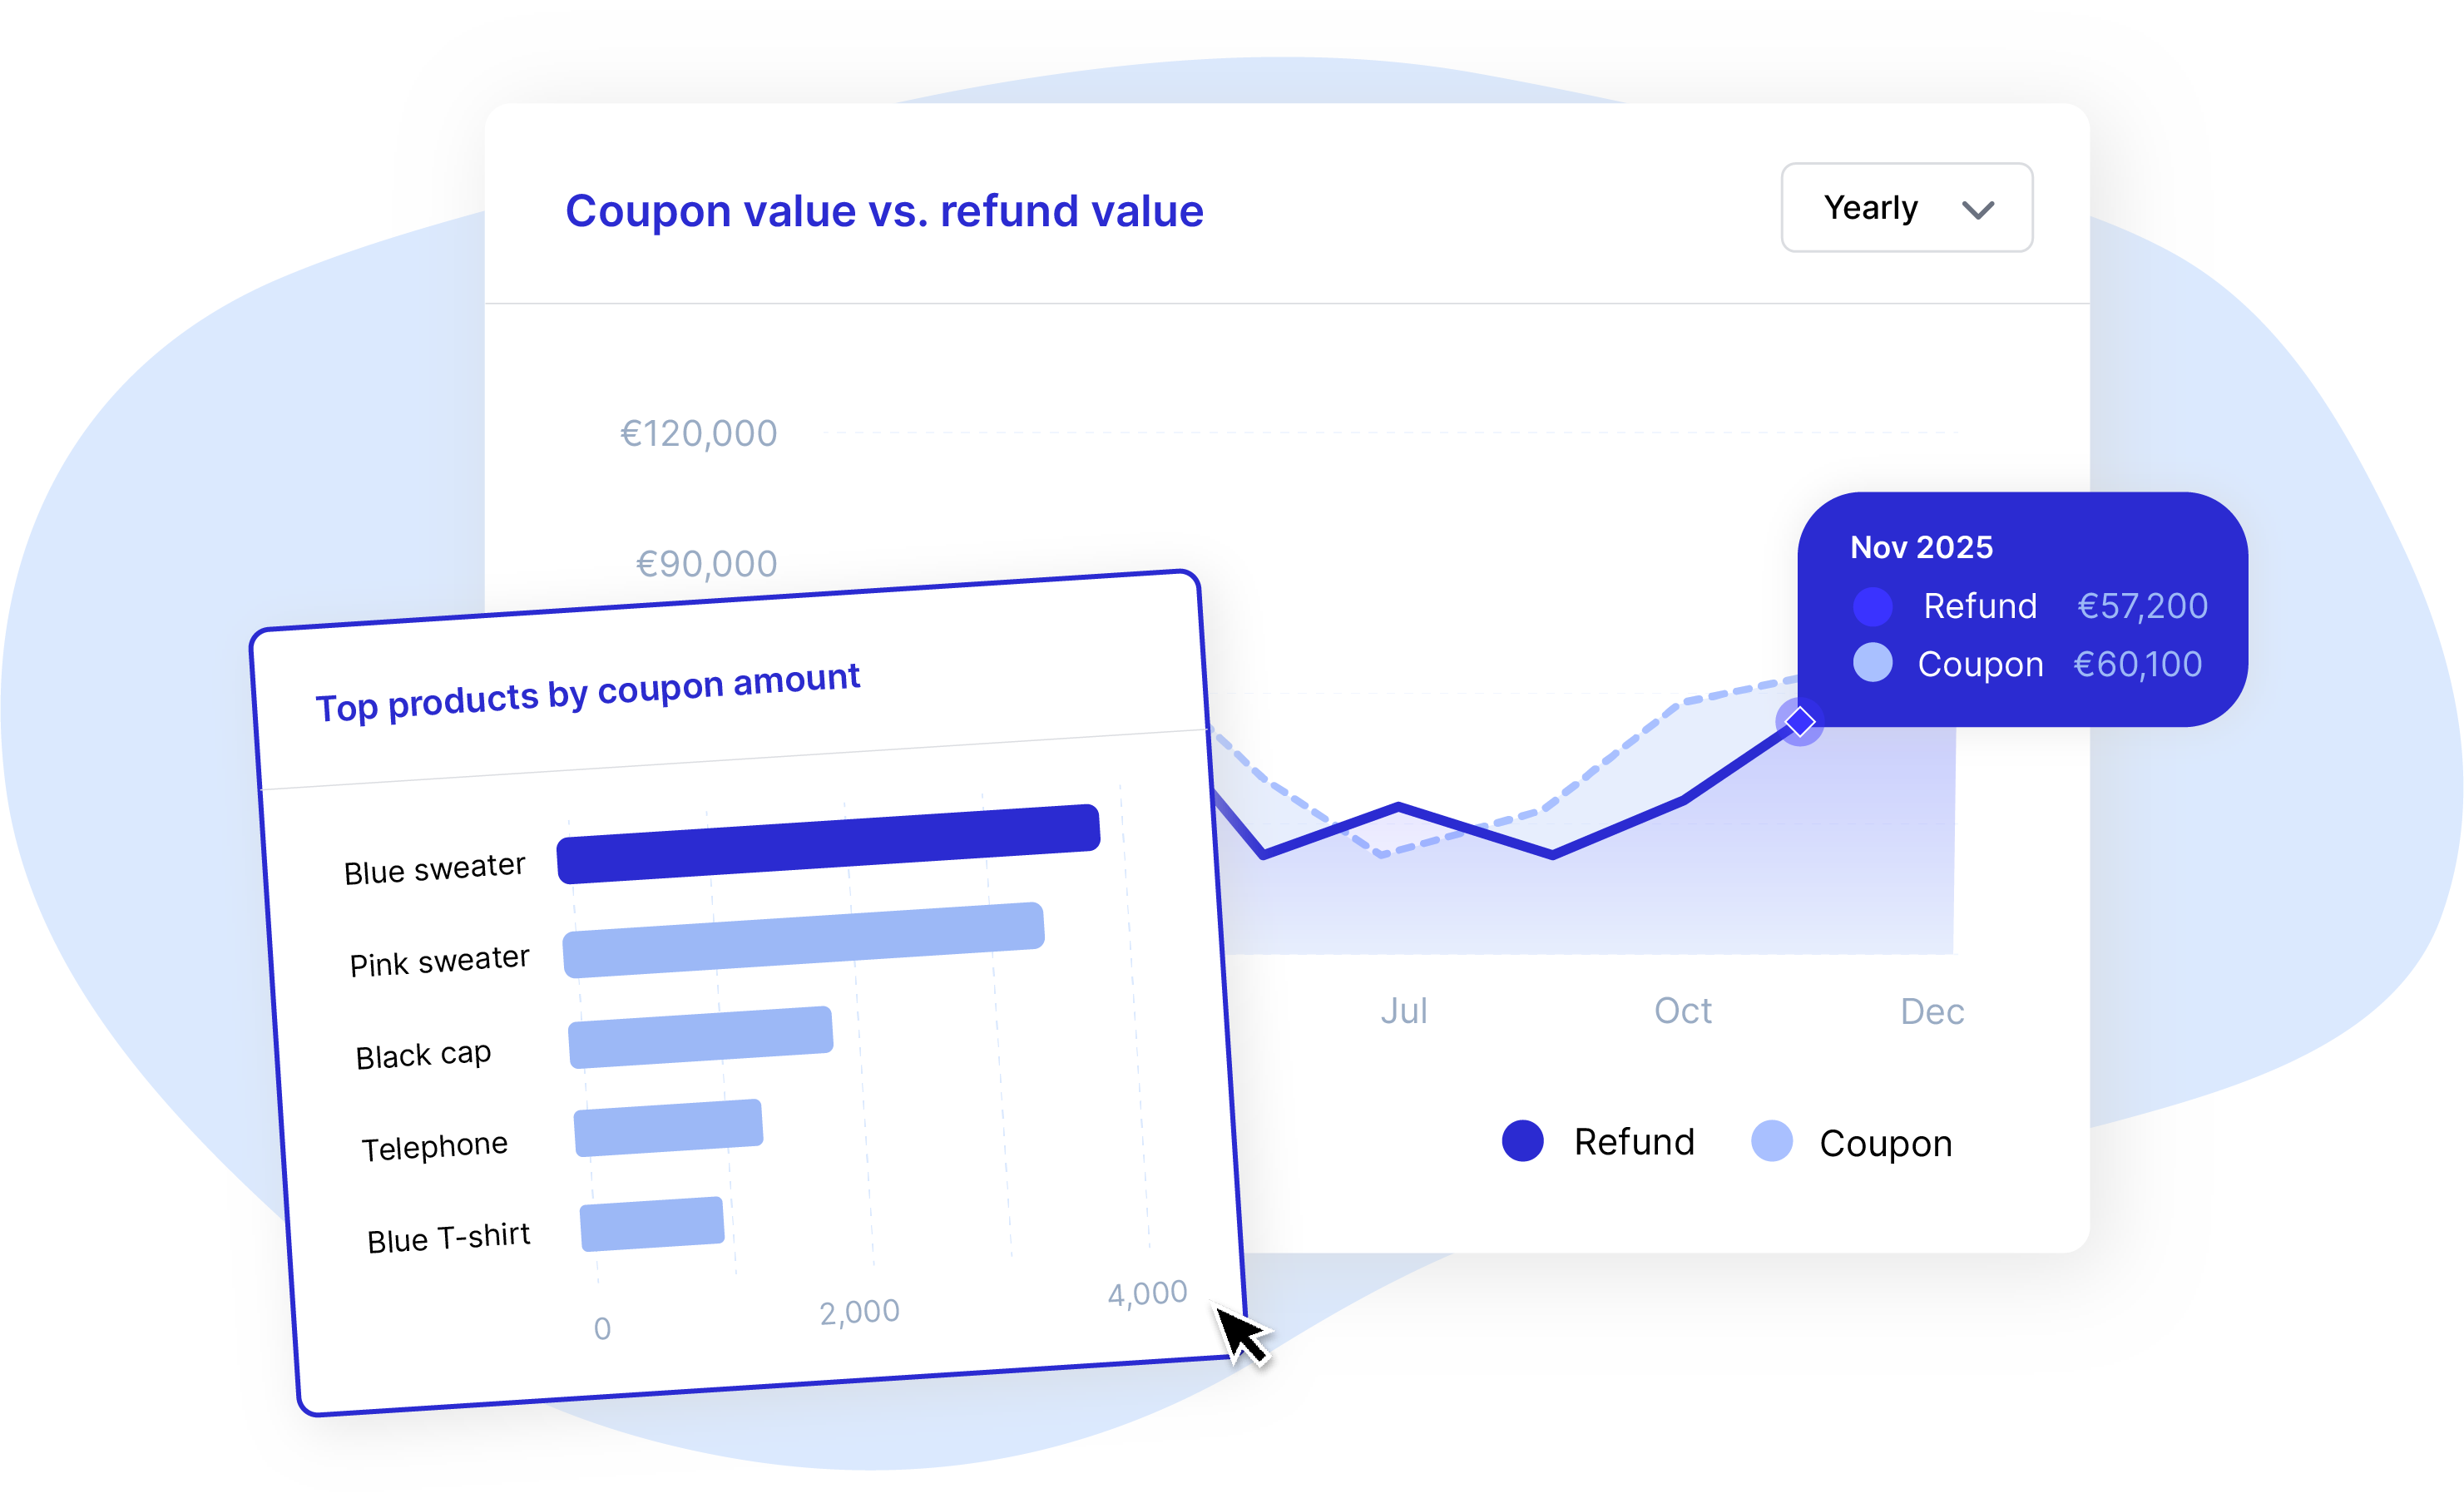
OPEN DASHBOARD
Retention Analytics

Retention Analytics

Protect and recover revenue

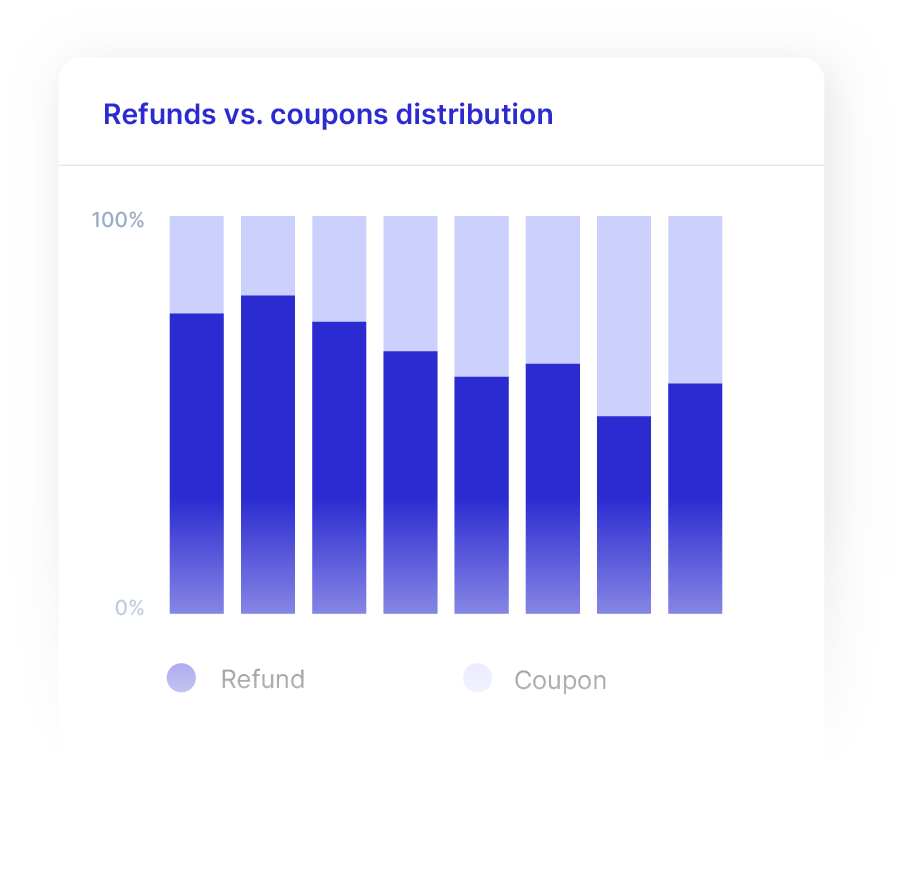
Retention Analytics shows exactly how return resolutions impact your revenue and customer lifetime value. 

How are returns resolved?
How much revenue is lost through refunds?
How much revenue is retained with coupons or giftcards?
Which products are most often resolved with coupons?

OPEN DASHBOARD

get started for free.

Play around and test out all features for free. Or schedule a demo with one of our colleagues if you'd like more info first.

Return portal return form